When You’re Out to Fix Bottlenecks, Be Sure You’re Able to Distinguish Them From System Failures and Slow Spots
So you found an odd pattern in your scatter chart that appears to be a bottleneck. What do you do now? How do you gather enough information to refute the inevitable response, “The application is fine, your tool/test is wrong”? And how do you present that information conclusively up front so you can get right down to working collaboratively with the development team to solve the problem?
Through years of experience as a performance testing consultant, I’ve learned something very important. It’s not safe to assume that most people really know what a bottleneck is—even if you’ve been doing performance testing for a long time and use the term “bottleneck” in everyday speech—particularly when it is contrasted with a system failure or a slow spot. To provide a teaching tool, I coined “Scott’s Eight Basic Rules for Software Bottlenecks,” which I’ll share with you below.
“Webster’s Millennium Dictionary of English” (Lexico Publishing Group, 2003) defines bottleneck as: “n: a narrowing that reduces the flow through a channel; v 1: slow down or impede by creating an obstruction; 2: become narrow, like a bottleneck…”
This definition is understandable and hints at the origin of the term (referring to the narrow part of a jar or bottle), but it is most useful to us if we note what it doesn’t say as well as what it does say:
- “reduces the flow,” not “ceases the flow”
- “slow down or impede by creating an obstruction,” not “stop by creating an obstruction”
- “become narrow,” not “become impassable”
I summarize this as follows:
Rule 1: A bottleneck is a slowdown, not a stoppage. A stoppage is a failure. Something else the dictionary definition doesn’t mention that will become relevant to us is “load” or “volume.” The fact that the definition says nothing about the cause of a bottleneck suggests that it shouldn’t be assumed that a bottleneck exists only under load or volume. In my experience, most folks assume that bottlenecks don’t exist unless a certain “trigger load” is applied to a system. This is both contrary to the definition of bottleneck and often untrue when applied to software systems, thus:
Rule 2: Bottlenecks don’t only exist under load. A useful comparison can be made, at least conceptually, between the flow of water through a pipe system and the flow of activity through a software system. To that end, let’s take a look at bottlenecks from a hydrodynamics perspective.
Figure A (below) shows the simplest possible version of a bottleneck in a pipe (you may notice that the drawing at first glance resembles a bottle). One can see that more water could flow through the section of pipe on the left than on the right, if they existed in isolation. The arrows in this diagram depict velocity, or the speed at which the water is actually moving through the pipe; the shorter the arrow, the slower the flow. Notice that the water is moving more slowly in the larger-diameter side of the pipe. This is a classic example of a queue.
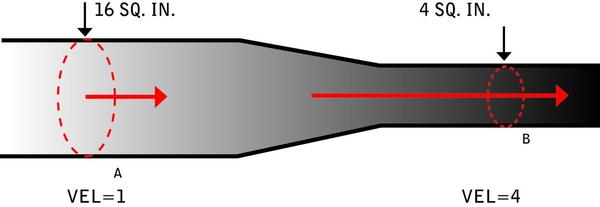
In terms of the flow rate, the water in the wider part of the pipe must virtually stop and wait for an opening in the narrower section of the pipe, and thus it flows very slowly until it reaches the “release point,” roughly where the narrower section of the pipe begins. Once it reaches the release point, the water starts flowing much faster. That “stop and wait” period is a queue. The bottleneck is the cause of the queue; it is not the queue itself. What’s important to note here is that the place where the pipe narrows is the bottleneck, but in fact the water flows most slowly just before the pipe begins to narrow. This brings us to:
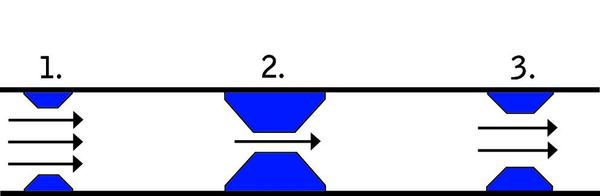
Rule 3: The symptoms of the bottleneck are almost never observed at the actual location of the bottleneck. In hydraulics, there’s another useful concept: the “critical” bottleneck, defined as the one bottleneck that, unless resolved, will dictate the flow characteristics of a system. In Figure B (below), you can see three sets of obstacles restricting the flow of water through the pipe. It’s easy to see that obstacle 2 is restricting the flow the most. In this case, obstacle 2 is the critical bottleneck, meaning that removing obstacles 1 and 3 won’t improve the flow of water through the pipe. More simply put:
Rule 4: The critical bottleneck is the one bottleneck along a particular user path, the removal of which will improve both performance and the ability to find other bottlenecks. Exploring critical bottlenecks introduces us to the concept of multiple paths through a system. When you extend a system beyond a single pipe into a closed system, you often add alternative paths through that system. Figure C (below) is an example of a closed hydraulic system.
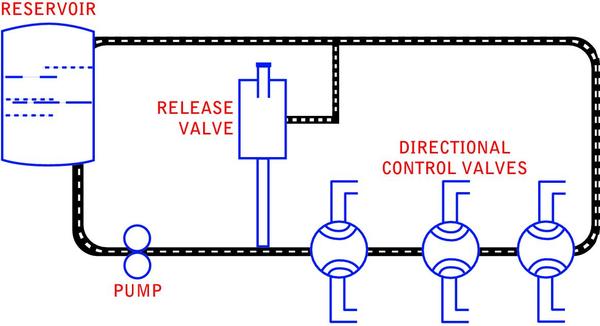
The difficulty of detecting bottlenecks in a system increases nearly exponentially with the number of possible paths through that system. In Figure C you can see that if there were a bottleneck in the pipe on the right side, the water could flow through the pipe in the center instead. This could lead to the appearance of a bottleneck in the center pipe, even though the bottleneck isn’t there (see Rule 3). Thus it’s important to remember:
Rule 5: If you have multiple paths through a system and think there’s a bottleneck, you should isolate each path and evaluate it separately. In the system depicted in Figure C, you can see some items other than pipes—a pump, valves and a reservoir. If you think of the pipes as your network and the other items as your hardware (Web server, routers and so forth), you quickly come up with:
Rule 6: The bottleneck is more likely to be found in the hardware than in the network, but the network is easier to check. When people started using the term “bottleneck,” the concept of software hadn’t even been invented. That fact alone should make us realize that the term probably has a special meaning when applied to software. Often, the term is used to refer to anything perceived to be slow in a software system, but this use is imprecise and should be avoided. Consider this scenario: Suppose one page on a Web site has several large images on it. When a user requests this page, it may take a long time to load. But unless downloading the graphics causes some other activity in the system to slow down, it’s not a bottleneck; it’s just a slow page, or what I call a “slow spot.”
A definition in “Load Testing for eConfidence” (a free book from Segue Software authored by Stefan Asböck) describes a bottleneck as “a point in a Web application where congestion and delay occur, slowing down the processing of requests and causing users to experience unacceptable service delays.”
The key to this definition is the word “congestion.” Unless an observed slowness causes some other activity in the system to slow down, it’s not a bottleneck; it’s just a slow spot. The next rule summarizes this:
Rule 7: Unless other activities and/or users are affected by the observed slowness or its cause, it’s not a bottleneck but a slow spot. In the course of defining “bottleneck,” we’ve made some distinctions that I’d like to spend a little more time on. The first is the distinction between a bottleneck and a failure. I think I’ve made it clear that a bottleneck is a slowdown, not a stoppage, meaning that the expected outcome is eventually achieved, regardless of how long it takes. For example, if you wait a long time but the requested Web page does eventually display properly, you’ve encountered either a slow spot or a bottleneck. If, however, you wait and eventually are presented with an error page instead of the requested Web page, this is a failure.
The interesting twist to this distinction is that sometimes a very minor change can transform the failure back into a bottleneck. Consider the example above. It’s entirely possible that in the second situation above, a timeout (failure) occurred due to a Web server setting. Changing that setting and reexecuting your test may result in all activities being completed successfully, but taking an unacceptable amount of time and slowing down all users—in other words, a bottleneck.
For our purposes, any time an error occurs, whether caused by a bottleneck or not, that error is a failure (you may prefer to call it a bug, a defect, an issue or an area of interest) and should be reported as such. When that failure prevents other users from completing their tasks in the expected manner, it’s a critical failure.
The main difference between a bottleneck and a slow spot is that a bottleneck has widely felt performance effects. A single large graphic can cause an annoying slow spot that may need to be resolved, but unless there are just tons of people downloading that graphic (a bottleneck caused by a popular activity) or your Web server is underpowered (a bottleneck caused by insufficient infrastructure), it’s just a slow spot that has no real effect on the rest of the system.
I’m making a big deal of these distinctions because as we continue our discussion about bottlenecks, we’ll see that we will often find failures and slow spots while we’re chasing bottlenecks, and we’ll need to distinguish among them in order to be able to take appropriate action.
Identifying Bottleneck Suspects
There are as many ways of identifying bottleneck suspects as there are people who’ve observed a slowdown when working on a computer. It’s our job as performance testers to identify as many of those suspects as possible and then sort, categorize, verify, test, exploit and try to help resolve them.
Let’s discuss some common ways to identify bottleneck suspects. For now, we won’t worry about whether these suspects might turn out to be failures or slow spots instead of bottlenecks.
Most performance testers like to identify bottleneck suspects visually, using graphs and charts. To that end, let’s take a look at some common ones.
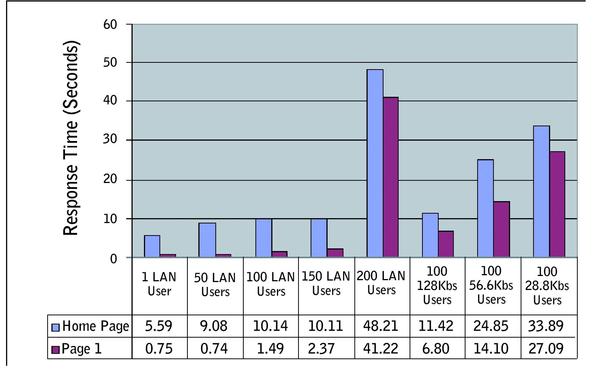
Figure D (below) is an example of a “response time by test execution” chart. Looking at this chart, you’ll immediately be able to see that there is a dramatic slowdown in response times between 150 and 200 users. While this doesn’t tell us what the bottleneck is, it does give us a good indication of where to focus our search for one.
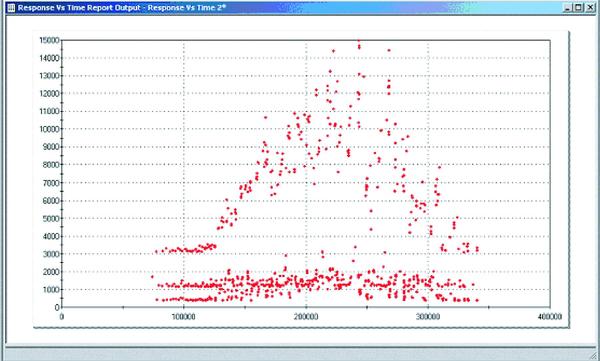
Scatter charts, such as the one shown in Figure E (below), are my favorite analysis tool, because of the ease with which you can identify bottleneck suspects using them. Simply put, any pattern that shows more than one dot (outlier) outside of your predefined acceptable performance levels reveals a potential bottleneck.
In addition to charts and graphs, user observations are another key method of identifying bottleneck suspects. Personal observation is one of your best tools for identifying suspected bottlenecks. As you’re creating scripts, you’re using the application. You get to “feel” what the performance is like, and you get a good idea of what types of activities cause the application to perform differently (better or worse) before you ever execute your first load test. These observations are extremely valuable, not only as a method of validating your scripts, but also as a means of identifying bottleneck suspects. Don’t assume that your tool is better at detecting bottlenecks than you are. The ultimate users of the system are people, not load-generation tools, and that alone makes your opinion—based on observation—more valuable than the numbers the tool reports.
Ultimately, other people will start using the system, generally while testing it. These folks will find all kinds of failures, slow spots and bottlenecks, whether they realize it or not. It’s important to talk to them and even observe them periodically to see and hear what they think of the system from a performance perspective. A simple comment such as “I don’t remember that search taking that long in the last version” is a big red flag that a bottleneck may be hiding somewhere in the search activity. The best part about that flag is that the search could have seemed pretty fast to you if you’d never used the preceding version. Don’t assume that your personal observation will result in the same suspects as the observations of a casual user will reveal.
Confirming Suspects
After you identify a list of bottleneck suspects, the next step is to confirm them. Confirming a suspect won’t necessarily confirm that the suspect is a bottleneck; rather, it will only verify that you’ve encountered some kind of performance issue that warrants further research.
The key to confirming a suspect is the ability to reproduce it. Until you can do that, the suspect is unconfirmed; and although unconfirmed suspects aren’t necessarily invalid, they’re generally given lower priority than confirmed suspects.
The single most important requirement for confirming a bottleneck suspect is the ability to reproduce the results that you or others have identified as indicating the suspect—that is, the symptoms. If the symptoms can’t be reproduced, it’s often the case that the observed condition that led to identifying the suspect was caused by something unrelated to the test. The easiest way to do this is typically to reproduce those results by repeating the exact test that displayed the results in the first place.
If the suspected bottlenecks were first observed while you were using a tool, you should try to do whatever you can to reproduce the symptoms manually. It’s always possible that your test itself is causing a symptom that real users won’t encounter. Always validate the accuracy of your scripts before considering a suspected bottleneck that was detected by a script to have been confirmed. Even then, you’ll want to try to reproduce that suspected bottleneck manually—both while no one else is on the system, and while the test is executing with the load at which the suspect bottleneck was first detected. The ability to observe the symptoms under one or both of these scenarios confirms a bottleneck suspect.
Additionally, if you observe symptoms of a bottleneck using tools, be sure you can reproduce those symptoms with similar tests—preferably with some variances, such as time of day, load, varying data or additional activities that seem to be unrelated to the symptoms. The ability to reproduce the symptoms in similar situations is a strong indicator that the issue deserves further research and is therefore a confirmed bottleneck suspect. These tests also tend to provide extremely useful information to the developers, who ultimately will be tuning the performance.
While you’re confirming your suspects, you should try to reproduce the symptoms with the simplest test (manual or automated) possible. For instance, try to reproduce the symptoms without load, or without performing any other activities while logged in as that user. It’s not absolutely necessary to be able to recreate the symptoms of the suspected bottleneck with a minimalist test, but it will answer one of the first questions that the stakeholders are bound to ask and will aid in your ability to demonstrate the suspect.
Just as with reproducing results using minimalist tests, reproducing results or symptoms using not-so-similar tests will help you demonstrate the existence of the suspect. It’s also a big step toward identifying the differences among a slow spot, a failure and a bottleneck. For example, a not-so-similar test may show that searching for a book and searching for a store near you on a retail site are both slow. If only searching for a store near you were slow, you might be tempted to think that something specific to that search was slow—a slow spot—but knowing that both types of searches are slow may lead you to think that the database is poorly tuned—that is, a bottleneck.
Reporting Confirmed Suspects
Effective reporting of confirmed suspects is extremely important—and tricky. You’re often met with skepticism, disbelief, defensiveness or dismissiveness. The first thing to remember is that you’re not alone. Every performance tester who’s ever reported a suspected issue has faced this. The second thing to remember is that if you’ve followed the approach outlined above, you have a confirmed, reproducible suspect to report. If you report it well, no one will be able to refute that it’s a valid suspect. On the other hand, if you present your suspects poorly, overstate or understate them, or don’t report them at all, they may never get addressed. It’s our job as performance testers to ensure that these suspects get taken seriously and addressed appropriately. Above all, if you want to be taken seriously, remember this:
Rule 8: When reporting bottleneck suspects, don’t assume that you know the cause; just report the symptoms. More specifically, don’t report suspected bottlenecks in a way that implies fault. Do describe all of the symptoms you’ve identified, not just the one you think is most relevant. Don’t speculate as to the cause of the bottleneck, even if you think you know what it is. Do describe all of the ways you’ve found to cause the symptoms. Don’t get defensive when challenged—it might really be the fault of your test—and always be prepared to support your claims.
Some other hints that I’ve found useful when reporting suspected bottlenecks include:
- Report verbally. Nothing improves your credibility or intra-team communication more than taking the time to discuss the symptoms rather than just e-mailing an observation.
- Report visually. As the old adage goes, “a picture is worth a thousand words.” Just make sure
that the picture tells the story you want it to.
- Report via demonstration. Virtually everyone will want to “see and feel” the bottleneck, especially managers, executives and end users, none of whom have a great interest in technospeak.
What the Development Team Needs to Know
After you report the symptoms of suspected performance issues you’ve identified, the developers may recognize the symptoms and be able to resolve them in short order. If not, they’re going to need more information. Let’s review some of the most common questions the development team is likely to have.
How did you get that to happen? See the section on reproducing results, above.
Which related user activities produce the same symptoms? Related activities can help developers determine what object, function, module or hardware component is causing the symptoms.
Which other activities are affected by the bottleneck? This also helps the developers narrow down the potential causes.
How many (or how few) users were performing the activity before and during the appearance of the symptoms? Bottlenecks don’t only exist under load, but knowing the load at which they become noticeable is critical to the tuning process.
What was the distribution in time (arrival rate) of the symptoms? Unrealistic user models can easily cause symptoms that simply would not occur in production. Arrival rates are the most commonly exaggerated part of user models.
What were other users doing before and during the appearance of the symptoms? Often there is a single trigger event that causes the bottleneck, and finding it can be quite challenging.
What data did you use to create the symptoms? Sometimes something as seemingly innocent as the distribution of users can cause bottlenecks.
What was the value of a particular measurement? No matter how much information you have, there is always something else that will help the developers.
Can you re-execute that test and tell me if…? Always be ready to modify your parameters and run the test again.
After presenting your findings and determining what other information the developers will need to help them resolve the issue, the next step is to design tests that will produce the information the developers are looking for.
When you’re designing the tests, don’t worry about how you’ll develop them with the tools you have available. Thinking about the capabilities of the tools at your disposal while designing will almost always lead you down the road of designing tests that are easy to implement, instead of tests that will provide immediate value. Instead, ask yourself “what if” questions. For example: “What would happen to these symptoms if I eliminated all other user activity? If I added more user activity? If I used different data? If I changed the load characteristics? If I tested from multiple IP addresses? If I used a different navigation path to get to this activity?”
It is also generally useful to ask developers to speculate as to what kind of test they think will generate results that will be most useful to them. Of course, while you are asking yourself and the developers these questions, remember to continue evaluating objects with slow responses, and think in terms of distinguishing failures, slow spots and bottlenecks from one another.
Armed with the answers to these questions, we can now get to the heart of the matter. How do you build tests to collect this next level of information using the tools you have? Unfortunately, there’s no cookbook answer. Every piece of information is found in a different way, and even that changes from application to application, platform to platform, and development style to development style. As it turns out, there are several directions you can follow. You can modify existing tests, create new tests with the same tool, create new tests with a different tool, or use test harnesses in combination with either the same or different tools.
I’ve seen and taken part in lots of debates about just what a test harness is. Let’s agree that for our purposes, the term “test harness” means any helper application or application modification created for the purpose of making it easier to use the tool or tools at your disposal to collect information about a performance issue.
Test harnesses can be used in many situations. For instance, a simple Web page with an input box and a Submit button that connects to the database, but bypasses the rest of the application, is a powerful tool. In this case, you could record a script that passes in various SQL statements and record the response time. This test harness will allow you to quickly eliminate the database as the cause of the issue without having to go through the whole battery of tests.
It’s unlikely that you’ll be the one developing test harnesses. You’ll have to work closely with your development staff to create them. You should consider having test harnesses built whenever you can’t find another way to isolate a piece of information, even if it seems like you should be able to do this using your other tools. Often, once you start discussing test harnesses with your developers, they’ll come up with ideas for test harnesses that will provide performance information they otherwise wouldn’t be able to obtain easily.
Is It Time to Tune?
More times than I would have thought, when I report bottleneck suspects, someone in the room responds, “Oops. I know what that is. Scott, I’ll call you in a few hours and ask you to rerun your tests. I’m pretty sure this will be fixed.”
As far as I’m concerned as a performance tester, this is the ideal situation. Nine times out of ten I go back to my desk and work on something else for an hour or two, the developer calls, I rerun the test, and that suspected performance issue is gone.
The truth is, while you’re reporting the symptoms of suspected performance issues, you’ll generally find yourself engaged in conversations about the cause of the symptoms. If there’s consensus as to both the cause of the symptoms and how the problem might be resolved, the attempt should be made to resolve it (that is, to tune) immediately. If either the cause or the resolution is unclear, you’ll want to continue modifying tests, exploiting and researching.
Teamwork Pays Off
Now that we’ve discussed detecting performance suspects, distinguishing between failures, slow spots and bottlenecks, and how to start tracking down performance bottlenecks to a level of detail great enough for developers to tune them, I’d like to reemphasize the importance of increasing your level of interaction with the development team. Without a good relationship with the development team, it’s unlikely that you’ll ever be certain of anything more concrete than suspects, symptoms and hunches. By working closely together, you and your development team should be able to detect and tune bottlenecks quickly and efficiently.
About the Author
Scott Barber Scott Barber is viewed by many as the world’s most prominent thought-leader in the area of software system performance testing and as a respected leader in the advancement of the understanding and practice of testing software systems in general. Scott earned his reputation by, among other things, contributing to three books (co-author, Performance Testing Guidance for Web Applications, Microsoft Press; 2007, contributing author Beautiful Testing, O’Reilly Media; 2009, contributing author How to Reduce the Cost of Testing, Taylor & Francis; TBP Summer, 2011), composing over 100 articles and papers, delivering keynote addresses on five continents, serving the testing community for four years as the Executive Director of the Association for Software Testing, and co-founding the Workshop of Performance and Reliability.
Today, Scott is applying and enhancing his thoughts on delivering world-class system performance in complex business and technical environments with a variety of clients and is actively building the foundation for his next project: driving the integration of testing commercial software systems with the core objectives of the businesses funding that testing.
When he’s not “being a geek”, as he says, Scott enjoys spending time with his partner Dawn, and his sons Nicholas and Taylor at home in central Florida and in other interesting places that his accumulated frequent flier miles enable them to explore.