Do you have questions on to how to implement a quality metrics program? What are the ingredients that are key to a well-established metrics program? What are some real-world metrics one could implement in their organization to guide improvement or quality transformation initiatives? If so, this article will be of value to you. I will outline a five ingredient metrics ‘vowel’ soup (five-step metrics program) with a case study from a financial services company to show how metrics helped guide a transformation effort.
First, how do you define ‘metric’ and ‘quality’? A metric is a measurable indication of some kind. Tom DeMarco’s simple definition is that a metric is a number attached to an idea. In software technology, metrics are typically used as follows:
- to monitor how something is performing
- to analyze the information provided to drive improvements
- to predict what will happen in the future by comparing plans to actual, or analyzing trends over time.
Crosby defined quality as ‘conformance to requirements’ and Juran as ‘fitness for use’. In this article, I use the term quality in two ways. One, as a broad qualifier in the context of transforming a quality assurance organization and the other, to share specific quality metrics used in such organizations. Metrics used to measure, monitor and improve quality are broadly termed as quality metrics. Software quality metrics can be classified along these broad categories – product or service, process and project.
A five-ingredient metrics ‘vowel’ soup (five-step metrics program)
Many organizations understand and realize the importance of metrics in evaluating and managing an organization’s performance and quality. However, most are not clear on what metrics to use, what measures to collect, how to collect measurements, and how to use collected measures effectively. Establishing and operating a metrics program is a very essential component to the successful management and improvement of a quality organization. I will outline a five-step process that can be used to build and operate a metrics program. Figure 1 below illustrates this process.
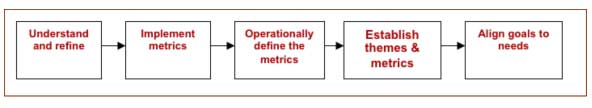
Figure 1: Five-step metrics program
- Align goals – Goals should be aligned to meet specific business needs. As seen with a quality-tinted lens, here are some illustrative goals:
- Increase customer satisfaction by 20% in 2 years
- Reduce cost of quality by 10% in 3 years
- Reduce mean time to repair (MTTR) by 3 days in 1 year
- Establish themes and associated metrics – Themes are useful when defining and presenting information back to stakeholders. I am drawing from the goal-question-metric (GQM) paradigm developed by Victor Basili. Goals are measured and tracked by metrics and metrics are broadly defined based on questions one can ask about how to accomplish a goal. One such set is illustrated below:
- Goal: Improve software quality in production year over year
- Questions:
- What is production quality of the system as it is today?
- How many issues escape the development and test process into production?
- How many issues are found in testing and does the process allow for most number of issues to be found early in the test lifecycle?
- Metrics: (Theme – Effectiveness)
- Production quality can be defined by new software defects found in production and by the number of total defects found in production
- Issue escape can be quantified by defect containment effectiveness of the development and test process
- Issues found early in testing can be indirectly measured by a metric like first-pass run rate.
- Operationally define the metrics – This involves defining the measures and metrics, the collection process, identifying the intended audience, guidelines on how to use the metrics and on reporting them to stakeholders. Measurements should answer the questions related to the goals, have information content that truly adds value, should be easy to collect and report, and be able to be modeled statistically. Shown below is an illustration of one such definition:
- Software defects in production are the number of software defects found in production, categorized by severity 1 and 2 defects. These measures are collected after every release into production and reported every quarter. The metrics are charted quarterly as a bar chart of severity 1 and 2 defects. Improvement is indicated by seeing a reduction in severity 1 and 2 defects over time. Any anomaly in a trend can be used to ask additional questions about the processes that affect this metric and any special cause variation in the process.
- Implement the metrics – This involves collecting, analyzing and reporting the metrics. The collection process involves collecting and capturing measurement data, analyzing the quality of measurement, deriving metrics from the measurement data, charting the metrics if required, analyzing the metrics, reporting the metrics and analysis to the intended audience, and using the metrics to monitor and manage against the established goals.
- Continuing the example above, defects found in production can be queried from the organization’s defect management system or business intelligence information store. These measures can then be charted every quarter manually or automated post-collection. If the trend of quarterly defects is going down, then it can be implied that the quality processes being employed in the development and test lifecycle are being effective. If the trend is going up, one would need to further analyze the defects, identify root causes, and then drive improvements. Such a chart can be part of a balanced scorecard or management dashboard used to communicate results to the organization’s management team.
- Understand the need for changes and refine the program periodically – As with any approach, as the metrics program matures, or as the organization’s quality needs change, it is critical to understand the changes and refine the program and its constituents.
- Continuing the example above, quarterly reporting of defect metrics in production may not be frequent enough to implement improvements quickly. So a refinement would be to chart these metrics monthly.
The old management adage, ‘if you can’t measure it, you can’t manage it,’ is the very reason a metrics program is key to managing either processes or projects, or managing quality improvements. Organization behavior many a time models the outcomes desired from metrics rather than working to achieve the overall goals. So, it is crucial to have a balance of complementary metrics to encourage the right behavior. For instance, let’s presume reducing customer issues is a quality performance metric. If reduction of issue backlog is the only metric, then managers can increase resources to reduce the backlog thereby addressing the symptom only. If reducing or maintaining cost of quality is also a performance metric, then increasing resources will increase the cost. It will then encourage managers to look at other ways to reduce backlog, one of which could be to reduce defects that are released to production.
Case Study: Quality transformation at a multi-national company
This case study is based on the transformation of a quality assurance organization and the quality function within a company over a three-year span. The following were key challenges seen initially:
- Inconsistent delivery and varying quality assurance capabilities
- Increasing trend of QA cost and cycle time supporting the organization growth
- Low initial quality and issues identified late in the lifecycle or production.
The goals for the three year transformation were around the following themes – Efficiency, Effectiveness and Capabilities. Based on the goals and the associated questions about how to achieve the goals, key practices and metrics were defined to monitor, report progress and manage the quality transformation. The goals, themes and metrics are shown in table 1 below.
| GOALS | THEMES | METRICS |
| Establish a global organization standardized on process and technology | Capabilities |
|
| Labor growth for QA should be 50% less than growth of the development team | Efficiency |
|
| Reduce cost of quality by 10% while supporting business growth | Efficiency |
|
| Reduce test cycle time by 10% without affecting quality | Efficiency |
|
| Improve quality of releases to production | Effectiveness |
|
Table 1: Goals – Themes – Metrics
The initiatives and accomplishments, guided by metrics, are summarized below.
Capabilities – Initiatives were implemented along the dimensions of people, process and technology. Software engineering and QA architecture functions were established to build and implement consistent quality practices. Informal SLAs were defined relative to QA and consistent assurance and test practices were deployed. The organization standardized on HP Quality Center for test management and IBM ClearQuest for defect management. The accomplishments as reported using the defined metrics were as follows:
- Over 800 people were trained in quality related practices
- Percent of projects employing appropriate QA roles increased from 40% to 80%
- All tests for core applications were stored in Quality Center and defects for all applications were managed in ClearQuest.
Efficiency – Initiatives implemented were in the areas of distributed operations, organization design and automation. In addition to consolidating operations to a few key locations, the team’s growth was limited to two global locations. Management span of control was optimized by flattening the team structure and employing a role-based engagement model. The team achieved automation on 30% of the core applications, by focusing on marquee features, multi-year legacy application regression and test data automation. The accomplishments were as follows:
- QA team grew by only 15% supporting a 35% development team growth
- Cost of quality reduced by up to 33% – to between 20% and 25% of project cost depending on project characteristics, from around 30%
- Test cycle time reduced by up to 28% – to between 18% and 20% of project cycle time depending on project characteristics, from around 25%.
Effectiveness – Initiatives implemented included end-to-end testing, peer reviews and development testing. Risk based testing was introduced as a QA strategy and discipline to clearly understand the failure impact on core business features and requirements, and the likelihood of finding high severity defects in production. Use of peer reviews was increased to contain defects in design and code, and automated unit and build testing was adopted to identify defects before release to test. The accomplishments were as follows:
- High severity defects in production decreased by 25%
- New software defects in production reduced by 35%
- On average, 90-day defect containment was between 90% and 95%, up from around 80%
- First-time pass rate improved by 20%.
Summary
Over a three year span, quality transformation at this company led to significant cost avoidance and savings. An organized and deliberate approach – of aligning goals, defining metrics, implementing them to monitor progress and make decisions over time, and using them to share accomplishments – was a key enabler to this transformation.
To establish a metrics program, start by understanding the business goals and the business context. Ask pertinent questions about how you would know if the goals will be achieved. Identify themes and metrics that will help answer these questions. Define the metrics in an operational context and implement them. Use the metrics as indicators and as a decision guide as initiatives are executed to achieve the business goals, and to periodically report accomplishments. Remember to balance the metrics so as to not encourage unintended behavior in the organization. Keep the metrics program simple and use stakeholder feedback and inputs to refine and improve the metrics over time.
About the Author
Harish Narayan Harish Narayan is currently a director of technology at Vistaprint, focused on quality assurance and automation. He is a software engineering and information technology leader with over 15 years of experience. He has expertise in building and leading world-class quality assurance functions, and in championing enterprise-wide process and capability improvements. He has been a proven business partner in diverse industries including telecommunications, financial services, e-commerce, enterprise software and consumer products. He also brings years of strategic planning, global operations, project management, performance management and team-building experience.