Without the Proper Metrics, All the Automation In the World Won’t Yield Useful Results
“When you can measure what you are speaking about, and can express it in numbers, you know something about it; but when you cannot measure it, when you cannot express it in numbers, your knowledge is of a meager and unsatisfactory kind.” —Lord Kelvin, Physicist
Metrics are an essential gauge of the health, quality, and progress of any automated software testing program. They can be used to evaluate past performance, current status and future trends. Good metrics are objective, measurable, sharply focused, meaningful to the project and simple to understand, providing easily obtainable data. And while many metrics used in conventional software quality engineering tests can be adapted to automated software tests, some metrics—such as percent automatable, automation progress and percent of automated test coverage—are specific to automated testing.
Before we discuss those and other metrics in depth, however, note that not every test should be automated just because it could be automated. Perhaps the most critical decision in the test case requirements-gathering phase of your automation effort is whether it makes sense to automate or not. And that decision itself is typically based on a metric: return on investment. Indeed, the test cases for which you can show that automation will deliver a swift and favorable ROI compared with that of general testing are the cases for which automated testing is justified.
START WITH THE END IN MIND
An integral part of any successful automated testing program is the definition and implementation of specific goals and strategies. During implementation, progress against these goals and strategies must be continuously tracked and measured using various types of automated and manual testing metrics.
Based on the outcome of these metrics, we can assess the software defects that need to be fixed during a test cycle, and adjust schedules or goals accordingly. For example, if we find that a feature still has too many high-priority defects, the ship date may be delayed or the system may go live without that feature.
Success is measured based on the goals we set out to accomplish relative to the expectations of our stakeholders and customers. That’s where metrics come in.
As Lord Nelson implied in his famous quote, if you can measure something, you can quantify it; if you can quantify it, you can explain it; if you can explain it, you have a better chance to improve on it.
We know firsthand that metrics and methods can improve an organization’s automated testing process and tracking of its status—our software test teams have used them successfully. But software projects are becoming increasingly complex, thanks to added code for new features, bug fixes and so on. Also, market pressures and corporate belt-tightening mean testers must complete more tasks in less time. This will lead to decreased test coverage and product quality, as well as higher product cost and longer time to deliver.
When implemented properly, however, with the right metrics providing insight into test status, automated software testing can reverse this negative trend. Automation often provides a larger test coverage area and increases overall product quality; it can also reduce test time and delivery cost. This benefit is typically realized over multiple test and project cycles. Automated testing metrics can help assess whether progress, productivity and quality goals are being met.
It serves no purpose to measure for the sake of measuring, of course, so before you determine which automated testing metrics to use, you must set clearly defined goals related directly to the performance of the effort. Here are some metrics-setting fundamentals you may want to consider:
- How much time does it take to run the test plan?
- How is test coverage defined (KLOC, FP, etc.)?
- How much time does it take to do data analysis?
- How long does it take to build a scenario/driver?
- How often do we run the test(s) selected?
- How many permutations of the test(s) selected do we run?
- How many people do we require to run the test(s) selected?
- How much system time/lab time is required to run the test(s) selected?
It is important that the metric you decide on calculate the value of automation, especially if this is the first time automated testing has been used on a particular project. The test team will need to measure the time spent on developing and executing test scripts against the results the scripts produced. For example, the testers could compare the number of hours to develop and execute test procedures with the number of defects documented that probably would not have been revealed during manual testing.
Sometimes it is hard to quantify or measure the automation benefits. For instance, automated testing tools often discover defects that manual tests could not have discovered. During stress testing, for example, 1,000 virtual users execute a specific functionality and the system crashes. It would be very difficult to discover this problem manually—for starters, you’d need 1,000 test engineers!
Automated test tools for data entry or record setup are another way to minimize test time and effort; here, you’d measure the time required to set up the records by hand vs. using an automated tool. Imagine having to manually enter 10,000 accounts to test a system requirement that reads: “The system shall allow the addition of 10,000 new accounts”! An automated test script could easily save many hours of manual data entry by reading account information from a data file through the use of a looping construct, with the data file provided by a data generator.
You can also use automated software testing metrics to determine additional test data combinations. Where manual testing might have allowed you to test “x” number of test data combinations, for example, automated testing might let you test “x+y” combinations. Defects uncovered in the “y” combinations might never have been uncovered in manual tests.
Let’s move on to some metrics specific to automated testing.
PERCENT AUTOMATABLE
At the beginning of every automated testing project, you’re automating existing manual test procedures, starting a new automation effort from scratch, or some combination of the two. Whichever the case, a percent automatable metric can be determined.
Percent automatable can be defined as this: Of a set of given test cases, how many are automatable? This can be represented by the following equation:
                  ATC            # of test cases automatable

PA (%) =  ————  =  ( ——————————– )

                  TC                  # of total test cases


PA = Percent automatable

ATC = # of test cases automatable

TC = # of total test cases
In evaluating test cases to be developed, what should—and shouldn’t—be considered automatable? One could argue that, given enough ingenuity and resources, almost any software test could be automated. So where do you draw the line? An application area still under design and not yet stable might be considered “not automatable,” for example.
In such cases we must evaluate whether it makes sense to automate, based on which of the set of automatable test cases would provide the biggest return on investment.: Again, when going through the test case development process, determine which tests can and should be automated. Prioritize your automation effort based on the outcome. You can use the metric shown in Figure 1 (see below) to summarize, for example, the percent automatable of various projects or of a project’s components, and set the automation goal.
FIG. 1: PERCENT AUTOMATABLE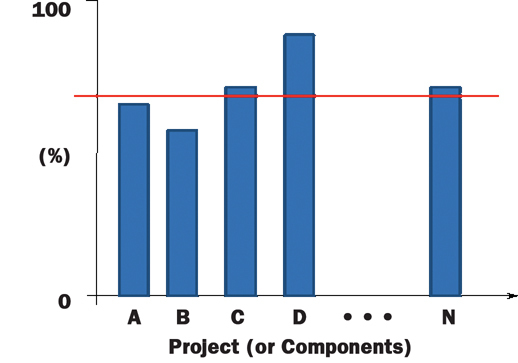
Automation progress: Of the percent automatable test cases, how many have been automated at a given time? In other words, how far have you gotten toward reaching your goal of automated testing? The goal is to automate 100% of the “automatable” test cases. It’s useful to track this metric during the various stages of automated testing development.
                 AA             # of actual test cases automated

  AP (%) =  ————  =  ( ——————————)

                    ATC              # of test cases automatable


AP = Automation progress

AA = # of actual test cases automated

ATC = # of test cases automatable
The automation progress metric is typically tracked over time. In this case (see Figure 2 below), time is measured in weeks.
FIG. 2: AUTOMATION PROGRESS
A common metric closely associated with progress of automation, yet not exclusive to automation, is test progress. Test progress can be defined simply as the number of test cases attempted (or completed) over time.
                     TC            # of test cases (attempted or completed)

TP  =  ————  =  ( —–––––––––—————— )

               T                time (days, weeks,months, etc.)


TP = Test progress

TC = # of test cases (either attempted or completed)

T = some unit of time (days/weeks/months, etc)
The purpose of this metric is to track test progress and compare it with the project plan. Test progress over the period of time of a project usually follows an “S” shape, which typically mirrors the testing activity during the project life cycle: little initial testing, followed by increased testing through the various development phases, into quality assurance, prior to release or delivery.
The metric you see in Figure 3 (see below) shows progress over time. A more detailed analysis is needed to determine pass/fail, which can be represented in other metrics.
FIG. 3: PROGRESS OVER TIME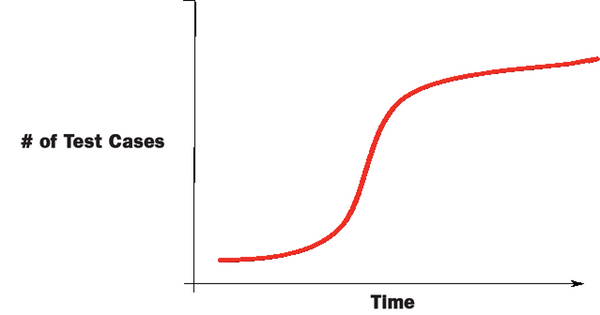
PERCENT OF AUTOMATED TESTING COVERAGE
Another automated software metric is percent of automated testing coverage: What test coverage is the automated testing actually achieving? This metric indicates the completeness of the testing. It doesn’t so much measure how much automation is being executed, but how much of the product’s functionality is being covered. For example, 2,000 test cases executing the same or similar data paths may take a lot of time and effort to execute, but this does not equate to a large percentage of test coverage. Percent of automatable test coverage does not specify anything about the effectiveness of the testing; it measures only the testing’s dimension.
                AC             automation coverage

 PTC(%) =  ———  =   ( —————————— )

                     C                    total coverage


PTC = Percent of automatable testing coverage

AC = Automation coverage

C = Total coverage (KLOC, FP, etc.)
Size of system is usually counted as lines of code (KLOC) or function points (FP). KLOC is a common method of sizing a system, but FP has also gained acceptance. Some argue that FPs can be used to size software applications more accurately. Function point analysis was developed in an attempt to overcome difficulties associated with KLOC (or just LOC) sizing. Function points measure software size by quantifying the functionality provided to the user based on logical design and functional specifications. (There is a wealth of material available regarding the sizing or coverage of systems. A useful resourse is Stephen H. Kan, Metrics and Models in Software Quality Engineering, 2nd ed. (Addison-Wesley, 2003).
The percent automated test coverage metric can be used in conjunction with the standard software testing metric called test coverage.
                  TTP                   total # of TP

 TC(%) =   ———  =   ( —————————— )

                 TTR            total # of test requirements


TC = Percent of testing coverage

TTP = Total # of test procedures developed

TTR = Total # of defined test requirements
This metric of test coverage (see Figure 4 below) divides the total number of test procedures developed by the total number of defined test requirements. It provides the test team with a barometer to gauge the depth of test coverage, which is usually based on the defined acceptance criteria.
FIG. 4: TEST COVERAGE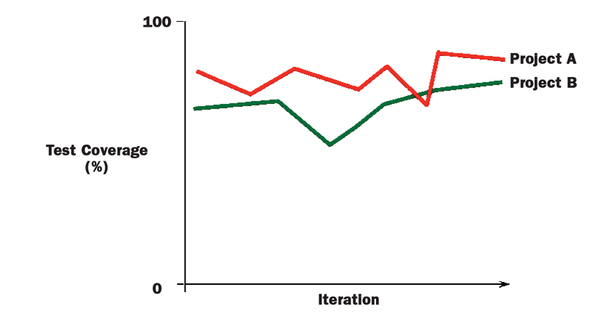
When testing a mission-critical system, such as operational medical systems, the test coverage indicator must be high relative to the depth of test coverage for non-mission-critical systems. The depth of test coverage for a commercial software product that will be used by millions of end users may also be high relative to a government information system with a couple of hundred end users.
DEFECT DENSITY
Defect density is another well-known metric not specific to automation. It is a measure of the total known defects divided by the size of the software entity being measured. For example, if there is a high defect density in a specific functionality, it is important to conduct a causal analysis. Is this functionality very complex, so the defect density is expected to be high? Is there a problem with the design/implementation of the functionality? Were insufficient or wrong resources assigned to the functionality because an inaccurate risk had been assigned to it? Could it be inferred that the developer, responsible for this specific functionality needs more training?
           D                # of known defects

 DD =  ——  =   ( ——————————— )

           SS              total size of system


DD = Defect density

D = # of known defects

SS = Total size of system
One use of defect density is to map it against software component size. Figure 5 illustrates a typical defect density curve we’ve experienced, where small and larger components have a higher defect density ratio.
FIG. 5: COMMON DEFECT DENSITY CURVE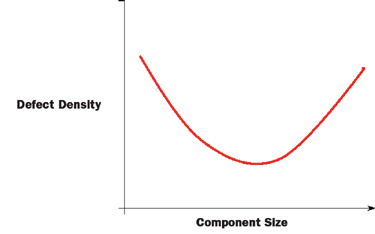
Additionally, when evaluating defect density, the priority of the defect should be considered. For example, one application requirement may have as many as 50 low-priority defects and still pass because the acceptance criteria have been satisfied. Still, another requirement might only have one open defect that prevents the acceptance criteria from being satisfied because it is a high priority. Higher-priority requirements are generally weighted more heavily.
Figure 6 (see below) shows one approach to using the defect density metric. Projects can be tracked over time (for example, stages of the development cycle).
FIG. 6: USING DD TO TRACK OVER TIME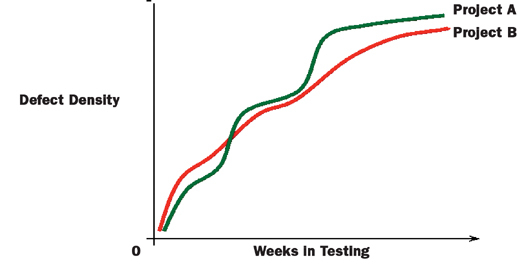
Defect trend analysis is another closely related metric to defect density. Defect trend analysis is calculated as:
                 D                  # of known defects

 DTA =   ———-  =   ( ——————————— )

               TPE          # of test procedures executed


DTA = Defect trend analysis

D = # of known defects

TPE = # of test procedures executed over time
Defect trend analysis can help determine the trend of defects found. Is the trend improving as the testing phase is winding down, or is the trend worsening? Showing defects the test automation uncovered that manual testing didn’t or couldn’t have is an additional way to demonstrate ROI. During the testing process, we have found defect trend analysis one of the more useful metrics to show the health of a project. One approach to showing a trend is to plot total number of defects along with number of open software problem reports (see Figure 7 below).
FIG. 7: DEFECT TREND ANALYSIS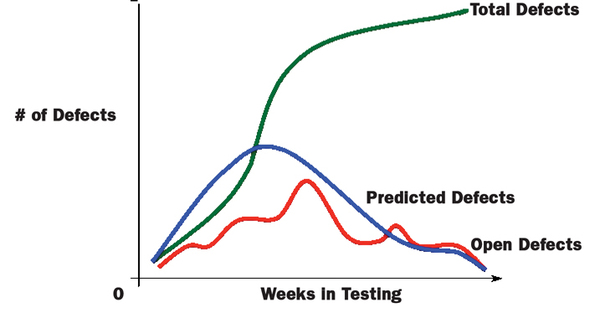
Effective defect tracking analysis can present a clear view of testing status throughout the project. A few more common metrics related to defects are:
Cost to locate defect = Cost of testing/number of defects located
Defects detected in testing = Defects detected in testing/total system defects
Defects detected in production = Defects detected in production/system size
Some of these metrics can be combined and used to enhance quality measurements, as shown in the next section.
IMPACT ON QUALITY
One of the more popular metrics for tracking quality (if defect count is used as a measure of quality) through testing is defect removal efficiency. DRE, while not specific to automation, is very useful in conjunction with automation efforts. It is used to determine the effectiveness of defect removal efforts and is also an indirect measurement of the quality of the product. The value of DRE is calculated as a percentage—the higher the percentage, the higher the positive impact on product quality because it represents the timely identification and removal of defects at any particular phase.
                                      # of defects found

	   DT                    during testing

DRE(%) =  —–—  =   ( ——————————— )

                DT+DA        # of defects found during testing +

                                                  # of defects found after delivery


DRE = Defect removal efficiency

DT = # of defects found during testing

DA = # of acceptance defects found after delivery
The highest attainable value of DRE is “1,” which equates to “100%.” But we have found that, in practice, an efficiency rating of 100% is not likely.
DRE should be measured during the different development phases. If DRE is low during the analysis and design stages, for instance, it may indicate that more time should be spent improving the way formal technical reviews are conducted, and so on.
This calculation can be extended for released products as a measure of the number of defects in the product that were not caught during product development or testing.
GET MORE SOFTWARE TESTING METRICS ONLINE

SIDEBAR: SOFTWARE TEST METRCS: THE ACRONYMS
AA # of actual test cases automated
AC Automation coverage
AP Automation progress
ATC # of test cases automatable
D # of known defects
DA # of acceptance defects found after delivery
DD Defect density
DRE Defect removal efficiency
DT # of defects found during testing
DTA Defect trend analysis
FP Function point
KLOC Lines of code (thousands)
LOC Lines of code
PR Percent automatable
PTC Percent of automatable testing coverage
ROI Return on investment
SPR Software problem report
SS Total size of system to be automated
T Time (some unit of time—days, weeks, months, etc.)
TC # of total test cases
TP Test progress
TPE # of test procedures executed over time
About the Author
Thom Garrett Thom Garrett has 20 years’ experience in planning, development, testing and deployment of complex processing systems for U.S. Navy and commercial applications. Specific experience includes rapid introduction and implementation of new technologies for highly sophisticated architectures that support users worldwide. In addition, he has managed and tested all aspects of large-scale complex networks used in 24/7 environments. He currently works for Innovative Defense Technologies (IDT), and previously worked for America Online, Digital System Resources and other companies, supporting system engineering solutions from requirements gathering to production rollout.