This article is based on experiences and research, giving you an insight into “the why” of our performance testing data-analyzing process and the possible outcomes.
You Have Performance Testing Results! What now?
Performance Testing, one of the testing techniques that has moved over the years from an “unknown & niche area” towards a profession and specialty, is becoming more and more recognized in the IT world. Therefore the outcome of the performance test attracts more attention from management and decisions are being made based on the outcome, namely “the results.” 1
Not only the results on their own are important, but also the existing expectation which rests upon our shoulders to identify the trouble maker “with one click” – if one exists. By troublemaker I mean a component, device, network or network segment, server… that is the cause of performance degradation and inconsistencies.
Performance testing results tend to be overwhelming, not only in the “values” but also in the amount of data gathered. You can measure “anything,” 2 but isn’t it better to restrict ourselves to measuring the “necessary” measurements? The process of analyzing and interpreting the results is often very detailed, complex and tedious. Also we cannot neglect the fact that we need to understand the different metrics and calculations that we are using for analyzing performance data results. 2
Over the years, while working together with several outstanding people I noticed that upon sitting in a meeting room, looking over the results of one performance test, there were several opinions about the same results. Being in such a situation, you easily can be “fooled” by your colleagues, peers, team members and by the “results” themselves! The question that pops up is: “How can this be?” and “Why is this happening?”
We are looking for answers to questions like:
- Are the goals of the performance test being defined? Why are we doing this test?
- Do you have data from the actual production site or from previous tests?
- What is the data you are looking at? Is it consistent, congruent, valuable, a snapshot or time slices related?
- Is management involved and supporting you? Are you being put in a sensitive situation?
- Are you in control of the data collecting process? Are you in control of the analysis and/or evaluation process, or not?
- Is a person’s background influencing the results collection process and/or the results analyzing process?
- Benefits of a certain outcome?
In my experience the definition of goals is indeed improving. But isn’t there a possibility of running into a pitfall of promises that the goals will be given “later.” Be vigilant because you know that this “later” can result into a “never” or “too late!”
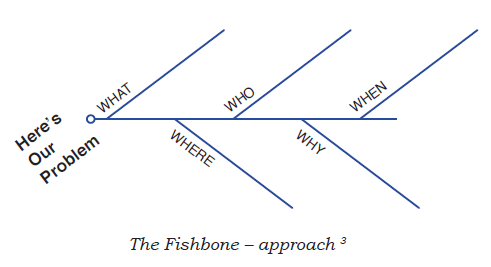
Using “the Fishbone”-approach 3 to identify root causes is a good way of setting the stage for examination of the results. It can help to steer the meetings with all team members and it sets a standard towards further performance testing analysis. It is better to use one approach for all your tests than having “flexible or multiple” approaches. This way you are more likely to compare apples with apples.
One of the items in the Fishbone-approach is “Why?” It is in my experience very important to identify e.g.: “Why is this happening” in order to figure out what you are looking at and also “why” you and the entire team are looking at this data!
We must not forget that everyone on the team has a different background. In other words, everyone applies a different mindset! A different set of patterns!
In order to understand the “why” we need to look at data in a different way, and determine what research is needed. Especially research in different areas other than “software testing.” We call it “out-of-the-box” thinking.
According to Jerry Weinberg 4:
“Organizations don’t choose their patterns of management action at random. Each pattern is a response to a series of demands placed on the organization. There are the demands of their customers, the demands of the type of problem they are trying to solve, and the internal demands generated by the way they did things in the past. It’s the interplay of these demands that determines whether an organization even has a chance to succeed using its current pattern.”
If we replace the word Organization(s) with “Performance Testers” and “management” with “examination of the results”, and apply it to Jerry’s quote:
“Performance Testers don’t choose their patterns of examination of the results action at random. Each pattern is a response to a series of demands placed on the Performance Tester. There are the demands of their customers, the demands of the type of problem they are trying to solve, and the internal demands generated by the way they did things in the past. It’s the interplay of these demands that determines whether a Performance Test(er) even has a chance to succeed using its current pattern.”
Now where do those patterns come from?
We, humans and animals, are pattern seeking creatures. Looking at some experiments like “Pavlov’s dog” and the “Skinner-box” or “the operant conditioning chamber” we have to come to the conclusion that we – living creatures – can easily adapt to a pattern.
Just look at these pictures. Do you see a pattern?
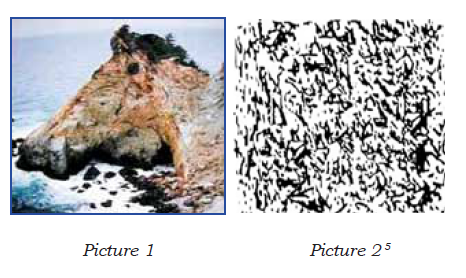
Michael Shermer 5, a well-known psychologist, academic historian of science, editor of Skeptic and adjunct professor at Claremont Graduate University says: “The human tendency to believe strange things – from alien abductions to dowsing rods – boils down to two of the brains most basic, hard-wired survival skills. Meaning, the tendency of finding meaningful patterns in both meaningful and meaningless noise, which can lead to 2 types of errors:
- A Type I error, or a false positive, is believing a pattern is real when it isnot (finding a nonexistent pattern).
- A Type II error, or a false negative, is not believing a pattern is real when it is (not recognizing a real pattern).”
In case you had a close look to the above pictures and identified a pattern in the first picture (Picture 1), then you are on the right track. Indeed there is a horse head pattern to be found. What about the second picture (Picture 2)? Did you find a pattern? In that case, you have run into the Type 1 error because this picture is eligible without any pattern.
You might be wondering why I’m talking about patterns and Human skills, backgrounds, beliefs… in relation to the examination process of the performance testing results.
Providing this performance test graph with the following data: Graph = requests pro minute, Web (3 tier), 3500 VUsers concurrent, Increasing test (1 hour of starting the 3500 VU and 2 hours constant generating requests). Now, what are your questions? Do you have ideas and/or maybe possible conclusions? Not enough “Data”? These questions will help you to steer your thoughts on investigating the results, like peeling an onion, layer by layer.
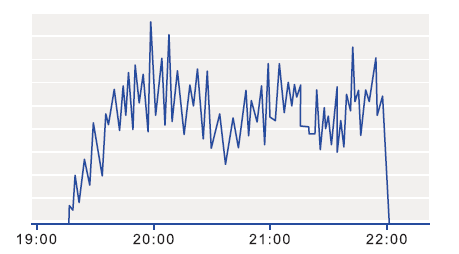
Picture 3: Performance Testing Graph
Did you find a pattern?
Is the incline a “normal” or “expected” result? If your answer is “this is normal” then we do not need to go any further.
In the case when it is not expected – you certainly want to know what the cause of it would be. And now, I know your pattern-seeking mind is looking for an answer, a pattern from your experience. Some of you will think, oh, this is a blockage or obstruction in the generating requests engine, the network (yeah – I see you are following the line from A to B and hoping to connect a line to C (maybe there is one, maybe there isn’t).
Continuing the analysis, what solution(s) in your pattern box can reside. Did the web server endure some problems? Application Server? DB server? Ah, yes one question: “The resulting graph is from which server?”
It is from the Application Server. Ok, now we are ruling out patterns we already had constructed in our mind and bringing in new ones.
Conclusion
After becoming more conscious about patterns and how easily we can fool ourselves, not only regarding my team members but also applying it to myself, I better understand the reasoning of my team members, and therefore I also had a better understanding of “why” some people came to a conclusion which was different than other people having the same ‘technical” know-how.
If you ever get stuck recalling a pattern for a performance testing results-set, why not use the “Six Thinking Hats” of Edward de Bono. 6
De Bono proposes a method where various thinking styles are associated with hats of different colors: white (objective), red (intuition/emotion), black (pessimistic), yellow (optimistic), green (creative), and blue (process). By explicitly applying different perspectives, you can nurture an idea to fruition, and you can get a fuller picture of the consequences. So, this approach can also be used for analyzing the results. Which explanation are you releasing to the management, the team,.. You might be surprised you may have more than one explanation.
Never-the-less, even using tools and tricks, it’s easy to fall into a particular pattern of thinking. For me the one rule that I learned is that looking for an “out-ofthe- box”-solution is not the way to go. It is better to “look out-of-the-box”.
References: [1] Laird L.M. and Brennan M.C., Software Measurement and Estimation: A Practical Approach, IEEE Computer Society, Wiley-Interscience, 2006 [2] Hubbard D.W. How to Measure Anything, Wiley, Chap. 9 pp. 139, 1962 [3] Derby E. and Larsen D. Agile Retrospective: Making Good Teams Great, pp. 87-89, 2007 [4] Weinberg G. M. Quality Software Management, Volume 1: System Thinking, pp. 127, Dorset House Publishing, 1992 [5] Shermer, M..The Believing Brain: From Ghosts and Gods to Politics and Conspiracies – How we Construct Beliefs and Reinforce Them as Truths. New York: Times Books, 2011. Illustrations from Jennifer Witson [6] de Bono, Edward (1985). Six Thinking Hats: An Essential Approach to Business Management., Penguin Books, 2000
About the Author
Mieke Gevers Mieke has been in the IT industry for 22 years and is a managing director at Aqis (Agile Quality in Information Systems). She has a Bachelors of Computer Science and started her career as a software developer, later moving on to various positions as analyst, project manager and, ultimately, QA Manager for several different companies in the Benelux region and Germany. Until November 2006 she has been with Segue Software, Borland for more than eight years rising from Technical Sales Engineer, Technical Manager, EMEA/APAC, Alliance Architect EMEA/APAC to Solution Architect, EMEE at Borland. Having developed special interest in the techniques and processes relating to test environment management and the impact of environmental factors on automated testing, she has been working with different automatic testing tools, specialising on Performance testing and monitoring.
Mieke is a regular speaker throughout Europe, the United States, Asia and Australia. She was a member of the Eurostar’s 2007 & 2009 & SEETest’s 2009 Program Committee and is currently Program Chair of Belgium Testing Days , 2011 & 2012. In 2006, she co-founded “the Belgian Testers Organisation” and is board member of KVIV and BNTQB and the International Representative at the ISTQB.