How to Get Your Relational Database Up to Speed Right Out of the Gate
The overall speed of an application will often depend on how fast the database runs. Most mission-critical business applications have at their core a relational database that maintains key persistent information. The performance of that relational database is absolutely critical—often the most important factor in the overall performance of the application. For this reason, when testing a database-driven application, it pays to give special attention to database performance.
It is also essential to ensure that your performance testing exercises the relational database in a realistic manner. In particular, stress or volume tests that are applied to an application that is running on an “empty” database might fail to discover significant performance problems that only occur when key database tables are populated.
In this article we’ll look at some of the key considerations when performance testing a database-backed application, in particular one that uses Oracle as the RDBMS.
Most of the general principles discussed in this article apply to other relational database management systems, such as SQL Server or UDB, but we’ll use Oracle-specific examples and techniques to illustrate those principles.
Performance by Design
Requirements errors are the most expensive to fix in production, and missing requirements are the hardest requirements errors to correct. Of all the quality defects that might make it into a production system, those that occur because a requirement was unspecified are the most critical. In the field, I tend to see missing performance requirements most frequently. Too often, the system requirements will specify what the system must do, without specifying how fast it should do it.
Missing requirements lead to missing test cases: If we don’t identify a requirement, we are unlikely to create a test for the requirement. Therefore, application problems caused by missing requirements are rarely discovered prior to the application being deployed.
Performance requirements are every bit as important as functional requirements and should be explicitly identified at the earliest possible stage.
Fig.1. Performance vs. Table Size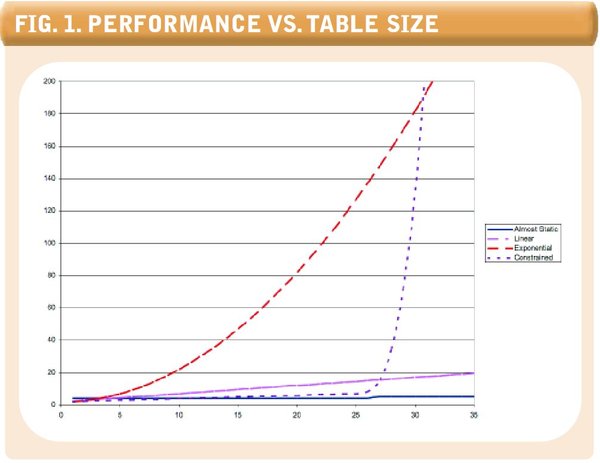
During performance testing, we should create test cases to measure the performance of every critical system interaction or transaction. If the existing requirements documents do not identify the performance requirements for a significant operation, we should flag this as a “missing requirement” and refuse to pass the operation until the performance requirement is fully identified.
Articulating Performance Requirements
In many cases, we expect a computer system to produce the same outputs when confronted with the same inputs; this is the basis for most test automation. However, the inputs into the performance of a routine can rarely be completely controlled. The performance of a given transaction will be affected by:
- The number of rows of data in the database
- Other activity on the host machine that might be consuming CPU or memory resources, or performing disk I/O
- The contents of various memory caches, including both database and operating system cache (and, sometimes, client side cache)
- Other activity on the network that might affect network round trip time
Unless you have complete control over the host that supports the database and the network between your application and the client (including the middle tier if appropriate), you are going to experience variations in application performance. Therefore, it’s usually best to define and measure performance taking these variations into account. For instance, you might express (and test) transaction response times in the following terms:
- In 99 percent of cases, transaction X should complete within 5 seconds.
- In 95 percent of cases, transaction X should complete within 1 second.
All critical database transactions should be associated with a performance requirement. Absence of such a requirement should be treated as a “missing requirement” bug.
Fig.2. Determining Response Time in Our PHP Application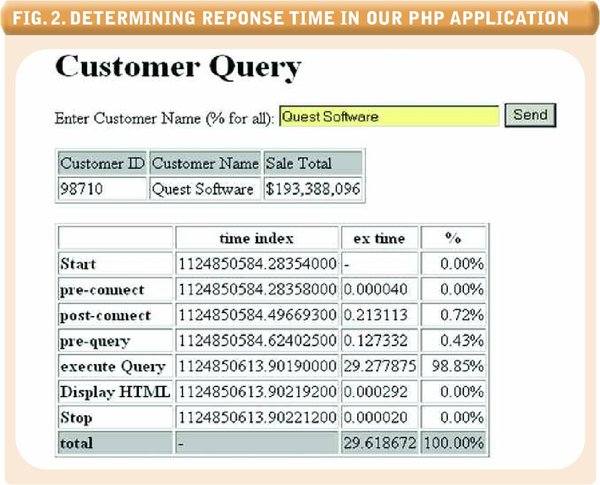
Sizing the Databases
The biggest mistake I have seen in testing the performance of database-driven applications has been failure to adequately size the test and development database tables used by the database transaction. The performance of all database interactions is affected by the size of the underlying database tables.
The relationship between performance and table size is not always predictable. In Figure 1 (see above) we see some of the relationships between table size and performance that we might encounter. The four most common patterns are:
Nearly static. This is the most desirable pattern, and in database applications is most often associated with an indexed lookup into a table.
Linear. This pattern is often associated with a “full table scan,” in which the response time is directly proportional to the number of rows in the table.
Exponential. This is a highly undesirable pattern in which the response time increases exponentially as the number of rows increases. This pattern is often seen with the notorious “nested table scans” SQL statement.
Constrained. This pattern is seen when response time varies suddenly and unpredictably as some system resource is exhausted. For instance, if rows from the database need to be sorted, the transaction will exhibit a sudden degradation in performance when the sort can no longer fit within the session’s sort buffer.
It is therefore essential to ensure that you make database tables as close to production size as possible. It’s not always possible to create full replicas of production systems for performance testing; in these cases we need to at least create volumes sufficient to reveal any of the unexpected degradations caused by exponential execution patterns.
Always simulate database table volumes that bear some reasonable relationship to the expected sizes of these tables in production. Testing with “nearly empty” database tables will fail to detect potentially disastrous performance problems in production.
Optimizer Statistics
Like most relational databases, Oracle maintains optimizer statistics that help it make wise decisions when it comes time to work out how to execute a SQL statement. You should make sure that you always collect optimizer statistics after sizing your test databases. These statistics should be collected regularly in production as well.
The DBMS_STATS package is used to collect these statistics. DBMS_STATS has a variety of routines and options, but in the simplest case, we simply use the GATHER_SCHEMA_STATS procedure to collect default statistics for a particular schema (table owner), as shown by the following command:
SQL> EXEC dbms_stats.gather_schema_stats('TESTDATA');


PL/SQL procedure successfully completed.
Make sure you gather Oracle optimizer statistics regularly in production, and ensure that you’re using up-to-date optimizer statistics before a performance test.
Measuring Performance
Users often measure performance subjectively. “Too long” can depend on the time of day, amount of application feedback and other factors. However, during system testing we evaluate performance against empirical measurements.
Response time. Application performance requirements are usually expressed in terms of elapsed time. Unfortunately, elapsed time can be harder to measure than system-oriented metrics such as CPU time or disk I/Os. A number of commercial tools exist to help you measure elapsed time in either benchmarking or production environments.
Fig.3. Report From Oracle TKPROF Utility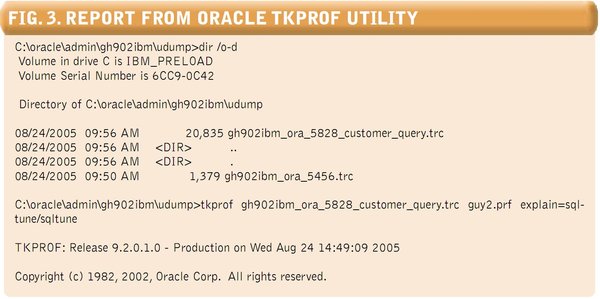
In the absence of such a tool, the best thing to do is to try to instrument the application itself. You can do this by inserting timing calls into the application using language-specific syntax, or you can take advantage of timing routines that are often made available for exactly this purpose. In this article I’ll show a simple example of embedding this sort of timing information in a PHP program.
If you are going to embed timing calls into your application, you should do so in a way that tries to answer two main questions (at least):
- As best as we can determine, what is the end user’s elapsed time (or, in the case of a batch job, the total elapsed time)?
- How much of this time is spent in the database?
You may find that after embedding your timing calls, you’ll discover that the application response time is OK, or that if it’s not OK, the time spent in the database calls is not excessive.
Tracing the database calls. If you are able to instrument your applications, you should also arrange to turn on database tracing so that you can drill into the database, if it turns out that the database time accounts for the majority of elapsed time.
In Oracle, you can create trace files using ALTER SESSION commands. For instance, the following creates a trace file suffixed with ‘guy1’:
SQL> alter session set tracefile_identifier=guy1;


Session altered.


SQL> alter session set sql_trace=true;


Session altered.
The trace file will be located in the USER_DUMP_DEST directory. I can query V$PARAMETER to find that location:
SQL> select value from v$parameter where name='user_dump_dest';


VALUE

----------------------------------------------------------

C:oracleadmingh902ibmudump
Now if I go to that directory, I will find my trace file:
C:sqlmysqldumps>cd oracleadmingh902ibmudump


C:oracleadmingh902ibmudump>dir *guy1*

 Volume in drive C is IBM_PRELOAD

 Volume Serial Number is 6CC9-0C42


 Directory of C:oracleadmingh902ibmudump


08/24/2005  11:50 AM             6,848 gh902ibm_ora_2164_guy1.trc
Putting It Into Practice
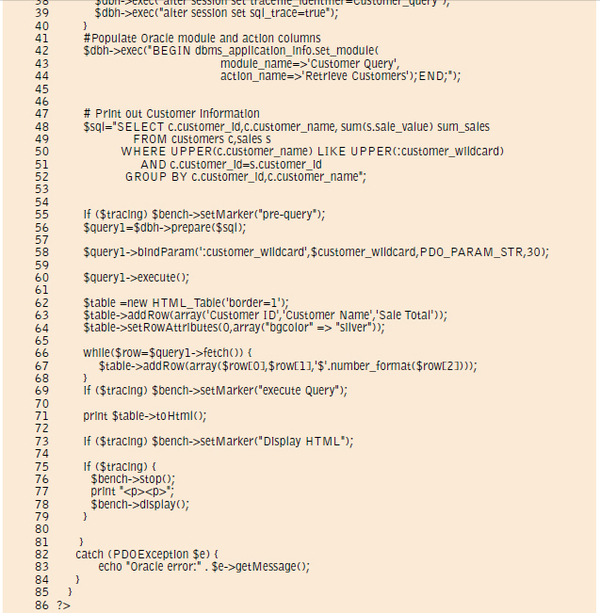
Let’s instrument a simple Web application, record its response time and track down whatever performance problems it might have. Example 1 (see below) is a simple PHP program that accepts a customer name (or a wildcard) from the user and prints out some details about any matching customer in the Oracle database. We’ve instrumented this PHP code to report on elapsed times from the application perspective, and also to generate Oracle trace files.
Even if you aren’t familiar with PHP, hopefully the flow of control should be fairly obvious. The script generates HTML to prompt the user for a customer name (lines 1-9), then uses the name provided to query Oracle for customer details (lines 48-60). The results are displayed as an HTML table (lines 62-71).
We’ve instrumented this code so that if the environment variable PHP_ORA_TRACE is set to TRUE we will generate response timings and trace files (line 15). The response times are calculated by the PHP Benchmark/ Timer module; the timer is initialized on lines 28-29, and timings are collected at various points thoughout execution (for instance, lines 32, 34, 69, etc.). The timings are finally displayed at lines 76-78.
We also issued the appropriate commands to generate an Oracle trace file if the PHP_ORA_TRACE environment variable is set (lines 38-39).
If we run the PHP script with tracing turned on, we will see output similar to that shown in Figure 2 (see above). The timing information indicates that almost 30 seconds have elapsed in retrieving our customer information and that 99% of that time was spent waiting for the database. Since all the time was spent in the database (not that unusual!), it’s time to look at our Oracle trace files.
To analyze our trace files, we run the Oracle tkprof utility to generate a report, shown in Figure 3 (see above). This generates the report shown in Figure 4, which identifies the SQL statement that is the primary contributor to our response time.
Analyzing tkprof output and tuning Oracle SQL is a big topic that we can’t cover in any detail here. However, in this case, cursory examination of the trace file indicates that the SQL is processing a large number of rows from the SALES table and that no index is being used to retrieve the data. Let’s create a couple of indexes to optimize this query:
SQL> create index sales_cust_value_idx on sales(customer_id,sale_value);


Index created.


SQL> create index cust_upper_name_idx on customers(upper(customer_name));


Index created.
With our new indexes in place, our performance is much better. Figure 5 (see below) shows the good news: Response time is now just over 1 second.
Where possible, instrument your application to obtain objective measures of transaction response time. If possible, generate Oracle trace files on demand during performance testing so you can trace performance into database SQL timings.
Example 1. Sample PHP Application Module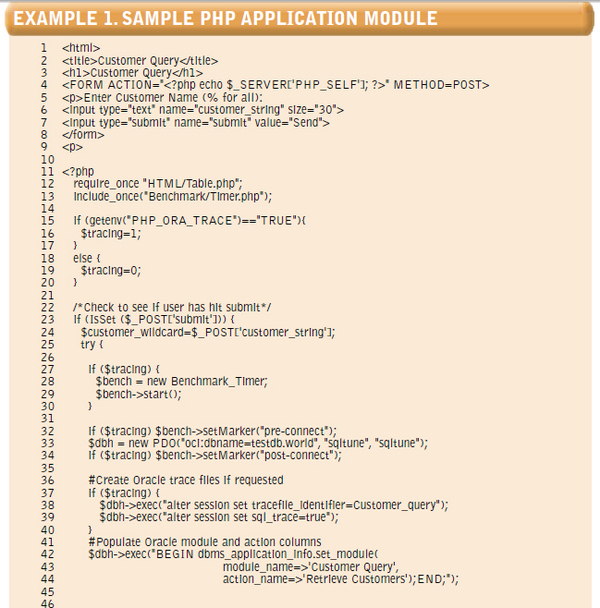
Overall Database Performance
It’s not uncommon to find that database performance overall is unsatisfactory during performance testing or even in production.
When all database operations are performing badly, it can be the result of a number of factors, some interrelated in a complex and unpredictable fashion. It’s usually best to adopt a structured tuning methodology at this point, in order to avoid concentrating your tuning efforts on items that turn out to be symptoms rather than causes. For example, excessive I/O might be due to poor memory configuration; it’s therefore important to tune memory configuration before attempting to tune I/O.
Structured Tuning Methodology
A structured tuning methodology starts by normalizing the application workload, then reducing any application contention. After that is done, we try to reduce physical I/O requirements by optimizing memory caching. Only when all of that is done do we try to optimize physical I/O itself.
Fig.4. TKPROF Report: Before Tuning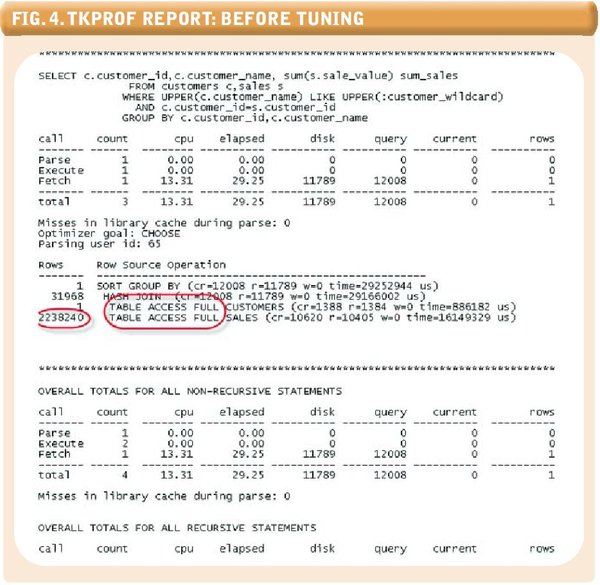
Step 1: Optimize application workload. There’s no point optimizing the database server to support a load that is unnecessarily high. Therefore, before we even start to look at memory configuration or disk I/O, or even think about the possibility of upgrading our hardware, we must make sure that the application is making sensible demands on the database server. This involves finding and tuning any SQL or PL/SQL routines that might be consuming excessive resources.
Even without specialized tuning tools, you can start by looking at the table V$SQL, from which you can find the most resource-intensive SQL statements.
When we have finished optimizing the application’s SQL and the application’s demands on the database are nominal, we can start to tune the database.
Step 2: Identify and eliminate contention. The application’s requests for database services will ultimately result in database I/O and CPU utilization. However, if there is any contention for resources within the database, we might not see the full extent of the demand on the database. So, our next step is to identify and eliminate contention.
Most database contention shows up as abnormal wait states, as might be shown in V$SYSTEM_EVENT (See “Breaking Down Database Time,” next page). Waits for “enqueue” (locks), “latch free,” “buffer busy” and “free buffer” should be eliminated before progressing to the next stage.
Fig.5. Performance of the Tuned Application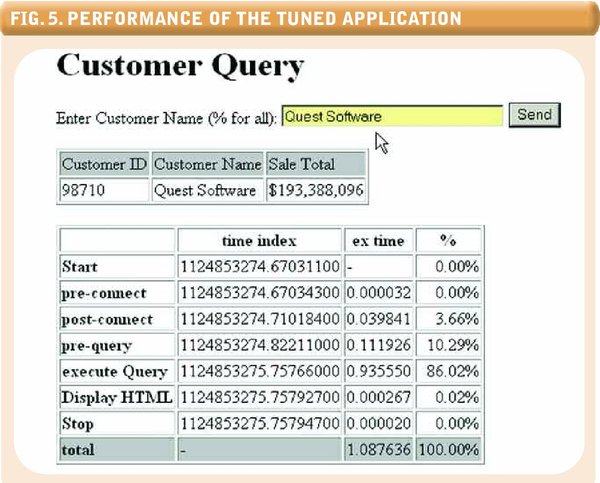
Step 3: Reduce physical I/O. The most expensive operation performed by the database is disk I/O, since disk I/O involves the physical movement of mechanical components in the disk devices and is orders of magnitude slower than CPU or memory-based operations. In Steps 1 and 2 we should have normalized the “logical” requests for I/O, and in this step we try to prevent these logical I/O requests from turning into physical disk I/Os.
Physical disk I/O has two major causes in Oracle:
1. Data is required to satisfy a query or update and is not already in cache.
2. A temporary dataset must be created to support a sort, join or other operation, and that dataset
is too big to fit into session memory (PGA).
Correctly sizing the two major Oracle memory structures—the SGA and PGA—is the key to minimizing disk I/O. Correct sizing is complex and beyond the scope of this article, but Oracle provides “advisories” that can help you work out what would happen if you changed the sizes of various memory components. (Tools are available that can generate advice for optimizing your memory against a given workload.)
Step 4: Optimize physical I/O. Now that we have normalized the application workload, eliminated contention and cached as much I/O as we can, it’s time to look at optimizing physical I/O. The optimization of physical I/O is simple in principle, though often complicated in practice. For a given physical I/O rate, we need to allocate enough disk spindles to support that rate and spread the I/O demand across those spindles.
Disks vary in I/O capacity, but typically a disk device can support maybe 50 to 100 I/O operations per second. If you measure or estimate your peak I/O rate at 1,000 physical operations per second, you may need between 10 and 20 spindles to support that rate.
The easiest way to spread the I/O demand across spindles is to use RAID 0 (disk striping). RAID 5 is rarely a good choice for database I/O, because although it spreads the read I/O across multiple spindles, it typically quadruples the overhead of write I/O.
Example 2. Oracle 10 g Time Model Data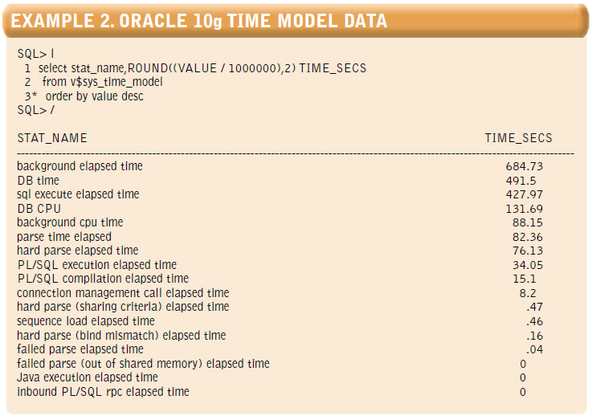
Breaking Down Database Time
We can’t provide a complete tutorial on Oracle tuning in this article, but here are some final tips on how to get started.
A common technique for almost any tuning is to break down elapsed time into various categories and then concentrate on the most time-consuming category. Oracle is very generous in terms of its response time diagnostics.
For instance, in Oracle 10g, the V$SYS_TIME_MODEL can show you at a high level where the time in the database is being spent. Example 2 (not yet available) provides a sample query.
V$SYS_TIME_MODEL shows you what database sessions are doing while they are active. However, just as important, Oracle can show you how much time sessions are spending waiting for resources to become available. Whenever an Oracle session needs to wait for another session to release a resource, or for the operating system to respond to a request, it records the wait in V$SYSTEM_EVENT. Typically, we will see time spent waiting for I/O here, but we might also see waits for table locks (shown as “enqueue” or “enq:”) and internal locks (shown as “latch”). Example 3 (see below) shows sample Oracle wait statistics.
Example 3. Oracle Wait Statistics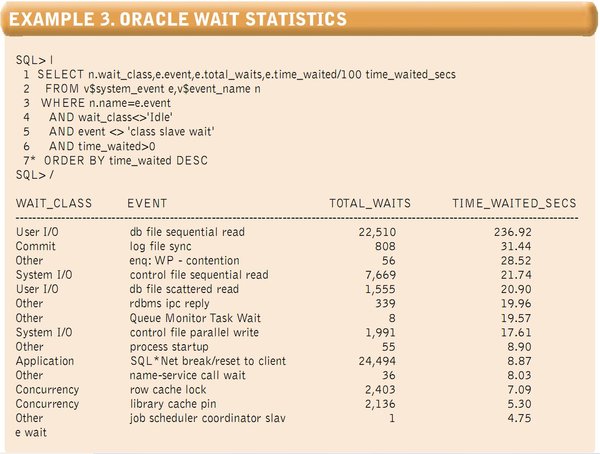
Key Things to Remember
In this article I’ve tried to give you a taste of some of the ways in which we should approach performance testing and optimization of an Oracle-based application. The key things to remember are:
- Define your performance requirements at the same time you define your functional requirements.
- Always test against a database with realistic data volumes, and make sure you collect optimizer statistics accordingly.
- Instrument your application where possible to report on end user response time and/or batch elapsed time, and to isolate the amount of this time spent in the database.
- For an individual module, use Oracle trace files where possible to isolate and tune the application SQL.
- When tuning the database as a whole, make sure you tune in a sensible sequence: Tune application SQL first, and adjust physical I/O configuration last.
- Become familiar with the Oracle virtual tables that break down database time.
About the Author
Guy Harrison